Margin-Based Pricing for AI Products
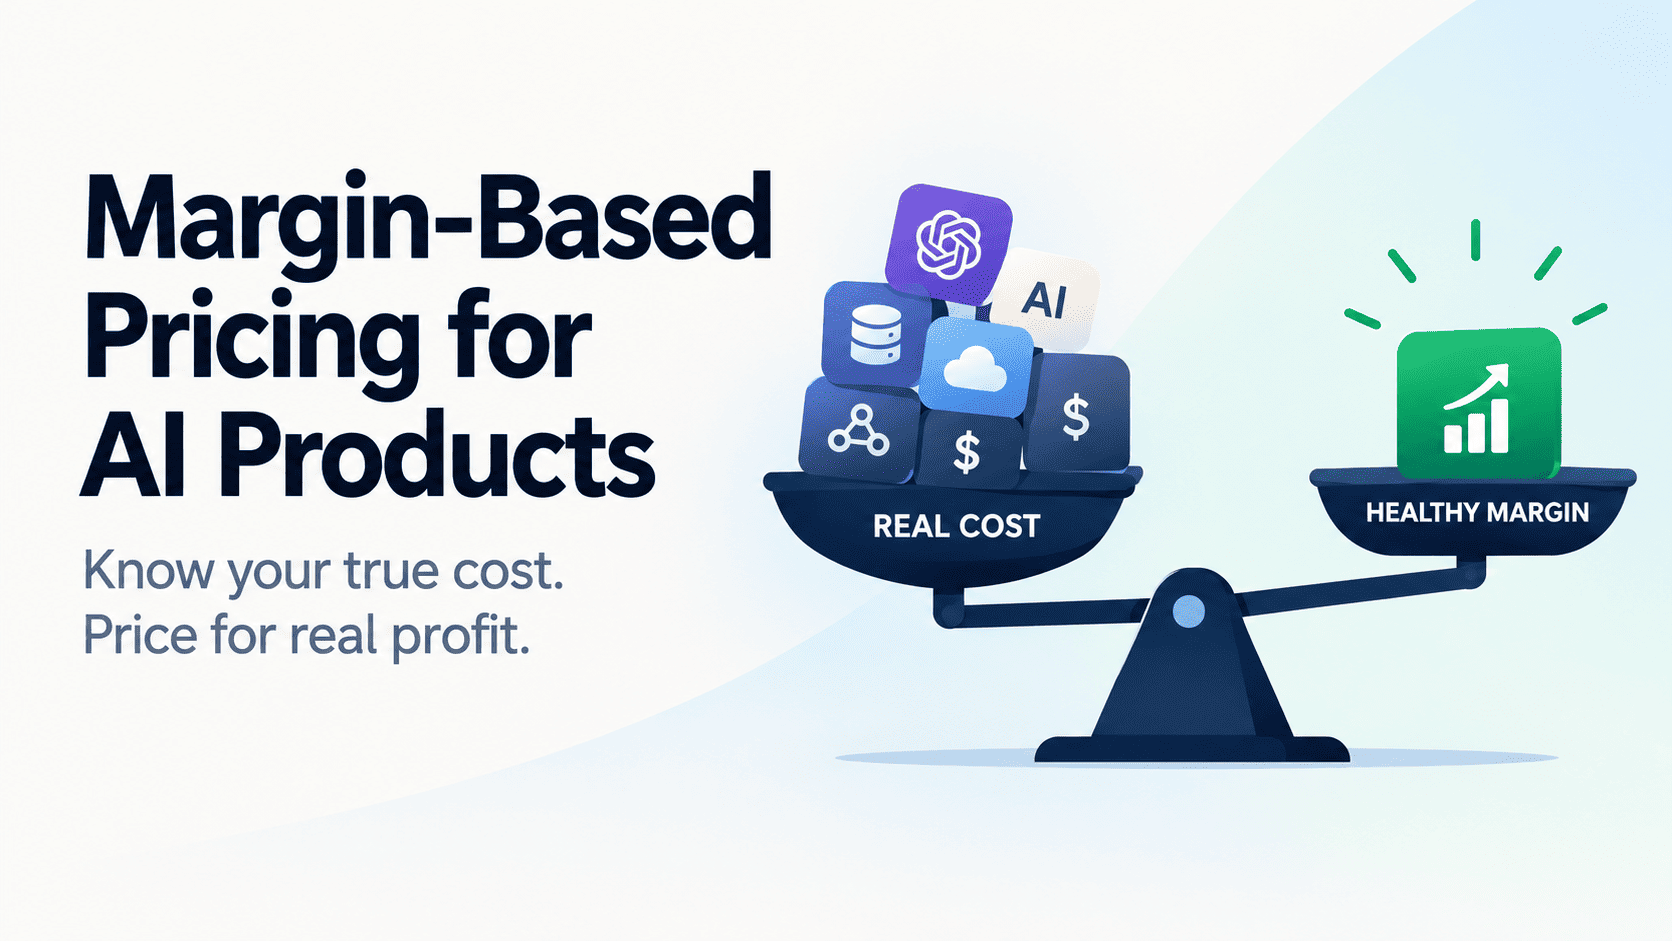
Margin-based pricing sets the price of an AI product from what each customer costs to serve, not from what the market will bear or what the model bill says in total.
A contract review product charges every customer $400 a month. Its blended margin is 65 percent, and the founder is content. Then the team tags model calls by account.
Ten customers cost $900 a month each to serve, and they are 5 percent of accounts but 32 percent of cost. The average hid them. This is the problem margin-based pricing solves. (Illustrative numbers.)
What margin-based pricing is
Margin-based pricing sets the price of an AI product from what each customer costs to serve, not from what the market will bear or what the model bill says in total. The founder knows the gross margin on every account, every feature, and every plan, and changes prices, limits, packages, or model choice when an account falls below the margin the business needs.
That sounds like ordinary business. It is. Any factory knows the cost of each unit it ships. Software companies lost the habit because for twenty years the cost of serving one more customer rounded to zero. A seat on a CRM costs the vendor a few cents of hosting a month. Pricing became a question of value and competition, and finance stopped asking what each customer cost.
AI products broke that. Every request a customer makes now carries a real, variable cost that the vendor pays to someone else. Two customers on the same plan can differ in cost by a hundred times. A flat monthly price built on the average loses money on the heavy user and overcharges the light one. Margin-based pricing is the practice of seeing that spread and pricing against it.
This article covers four things. What the problem looks like inside a company. Why AI cost behaves differently from past software cost. How to build the margin view and act on it, step by step. And where the current tools help and where they stop.
The problem: revenue goes up and nobody knows where the profit went
The pattern repeats across AI companies of every size. Revenue grows. The model bill grows faster. The founder can see both totals and cannot connect them.
The revenue side lives in the billing system. Stripe or Chargebee knows who paid what and on which plan. The cost side lives in three or four other places.
OpenAI, Anthropic, and Google each send an invoice. The vector database sends one. The data vendor the agent calls for lookups sends one. The cloud bill carries the compute that runs it all. None of these invoices names a customer. They name an API key, a project, or an account owned by the vendor.
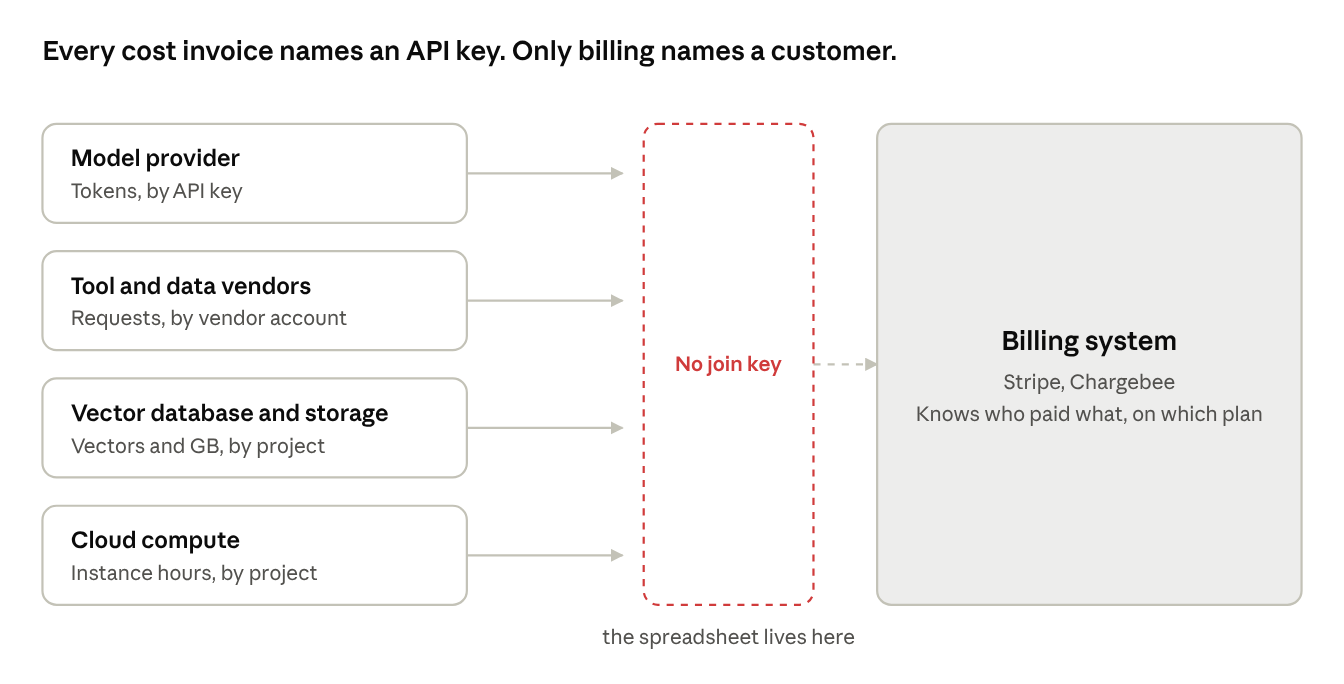
Four invoices know what you spent. One system knows who paid you. Nothing in between knows both.
So someone builds a spreadsheet. It pulls token counts from a logging tool, applies the price per token, and divides by customer. It is right for about a week. Then a provider cuts prices, a new model ships, a feature starts calling a second tool, and the spreadsheet drifts from the truth. Nobody trusts it, and nobody has time to rebuild it.
Meanwhile the heavy accounts keep running. A customer on a $500 plan who runs long documents through an agent all day can cost $900 a month to serve. The founder does not know this. The customer is happy. The account shows up in the dashboard as a success story. Each renewal locks in another year of loss.
The damage shows up in three places:
- Gross margin. AI software companies that report their numbers often show gross margins in the 50 to 60 percent range, against 75 to 85 percent for classic SaaS. Part of that gap is unavoidable. Part of it is accounts that were mispriced from the start.
- Pricing decisions. Without a cost per account, every pricing change is a guess. Raise prices and you can lose customers who were profitable. Add a usage cap and you can cap the wrong people.
- Fundraising and acquisition. Buyers and investors now ask for margin by cohort and by customer. A company that cannot produce it looks like it does not understand its own business, because it does not.
Why this is new: AI cost does not behave like software cost
Classic SaaS had three properties that let vendors ignore cost per customer. Marginal cost was near zero. Usage per seat fell in a narrow band. And the vendor controlled the cost base, so it only moved when the vendor changed it. AI products break all three.
Marginal cost is real. Every request is paid for in tokens, and the vendor pays a third party. MarginWard puts the cost of goods for AI products well above classic software, with gross margins that often run near 50 percent against 75 to 85 percent for the software businesses that came before. Monetizely reports Bessemer data showing fast-growing AI startups averaging around 25 percent gross margin early on and steadier ones reaching about 60 percent. Those are not bad companies. They are companies whose cost moved and whose prices did not.
Usage varies by orders of magnitude. Output tokens cost three to five times input tokens. Reasoning models cost ten to fifty times more than small models for the same task. An agent that loops through a document ten times costs ten times what a single pass costs. Two customers on the same plan, doing what looks like the same job, can differ in cost by a hundred times. The average tells you nothing about either of them.
The cost base moves without you. Providers cut prices, ship new models, and retire old ones on their own schedule. The same reports describe inference prices falling 80 to 90 percent a year for a fixed task. That sounds like good news, and it is, but it means any price you set from a cost snapshot is wrong within a quarter. Falling costs also tempt founders to wait rather than fix pricing, which works until a customer finds a use that scales faster than the price cuts.
Cost spreads across invoices. A single user action in an agent product can trigger a model call, three tool calls, a database lookup, and a request to an outside data vendor. Revenium calls the result the iceberg effect. The model bill is the part above the water, and in its worked examples it is a small part. One loan pre-approval workflow showed a model bill near $1,200 a month against a real cost near $9,000 once tool calls and data lookups were counted.
The early seat-pricing experiments showed the damage. Monetizely cites reports that GitHub Copilot lost around $20 per user a month in early 2023, with heavy users costing up to $80. It also cites reports that Replit’s gross margin sat under 10 percent in 2024 before a move to usage pricing lifted it to 20 to 30 percent. These are secondhand figures, so read them as directional. The direction is clear.
The four sources of cost, and why they land on different invoices
Before you can price on margin you have to know where cost comes from. In most AI products it comes from four places, and each one is billed by a different party in a different unit.
| Source | What drives it | Who bills you | Unit on the invoice | Names a customer? |
|---|---|---|---|---|
| Model inference | Input and output tokens, model tier, retries, context length | OpenAI, Anthropic, Google, or a cloud host | Tokens by model, per API key or project | No |
| Tool and data calls | Web search, document parsing, credit or identity lookups, enrichment, geocoding | Each tool or data vendor | Requests or records, per account | No |
| Storage and retrieval | Embeddings, vector search, document storage, caches | Vector database, cloud storage | Vectors stored, queries, GB per month | No |
| Compute and orchestration | Servers that run the agent loop, queues, observability, logging | Cloud provider, logging vendor | Instance hours, GB ingested | No |
The last column is the problem. Not one of these invoices knows which of your customers caused the charge. They know your API key. The only system that knows your customers is your billing system, and it knows nothing about cost.
Three features of this table matter for pricing. First, the mix changes by feature. A chat feature is almost all inference. A document agent is heavy on parsing and retrieval. A research agent can spend more on outside data than on the model. Margin by feature is often more useful than margin by customer, because features are what you can repackage.
Second, the model line is the one everyone tracks and often the smallest. Revenium’s examples show tool and data costs running at several times the model bill in agent workflows. A margin view built only from token logs will look healthy and be wrong.
Third, the cheapest cost to cut is rarely the model. Caching a repeated lookup, trimming the context you send, or stopping an agent after three loops instead of ten can cut more than switching providers, and does not change what the customer sees.
How to do it
Margin-based pricing is five steps that run as a loop. The first three build the view. The last two act on it. Most companies that try this stop after step three, with a dashboard that everyone admires and nobody uses.
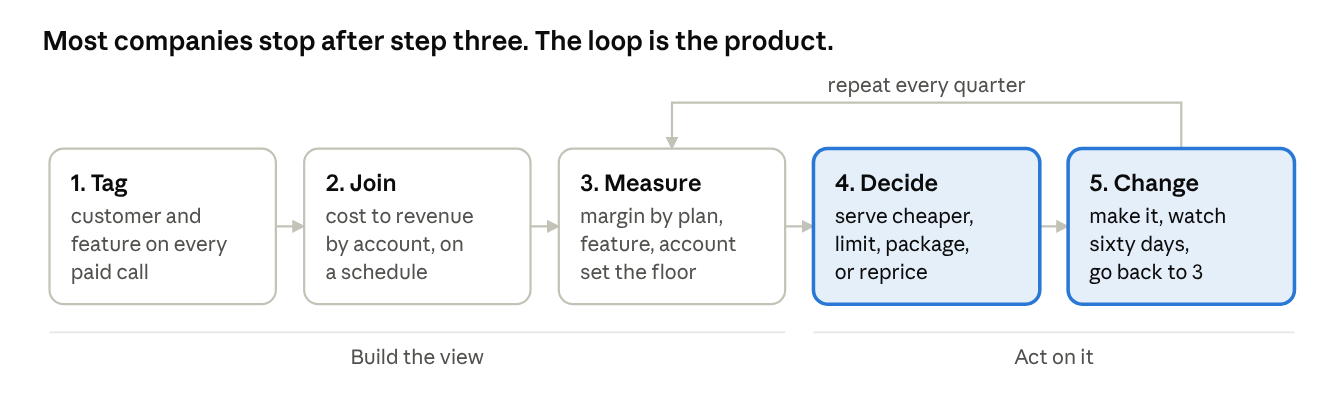
Steps one to three produce the view. Steps four and five, the shaded ones, are where margin changes.
- Tag every paid call with a customer and a feature. This is the step that makes everything else possible, and it happens in code, not in finance. Each call to a model, tool, or data vendor carries two fields in its metadata: which customer account caused it and which product feature it belongs to. Most model providers accept a user or metadata field for this. For vendors that do not, log the call yourself before you make it. Without this tag, no later step can recover the information. Cost allocation after the fact is guesswork dressed as accounting.
- Join cost to revenue at the account level. Pull the tagged cost records into one place alongside the billing system’s record of what each account paid. The join key is the customer account. For each account, each month, you now have revenue, cost by source, and cost by feature. Do this on a schedule, not once. A weekly job that pulls provider usage exports and billing data is enough for most companies. The spreadsheet failed because a human had to run it. This cannot depend on a human remembering.
- Compute margin at three levels and set thresholds. Gross margin by account, by feature, and by plan. Then decide what margin the business needs. A company at 50 percent that wants 70 has a different problem from one at 68 that wants 70. Set two lines. A warning line where an account gets reviewed, and a floor where it gets acted on. Alert when an account crosses either. Also compute the distribution, not just the average. The point is to find the 5 percent of accounts that eat 40 percent of cost, and an average hides them by design.
- Decide what to change. For each account or feature below the floor, there are four kinds of fix, covered in the next section. Price it differently, package it differently, limit it, or serve it more cheaply. Pick the one that fixes margin with the least change to what the customer experiences. A model swap the customer never notices beats a price increase the customer resents. Write down the expected effect before you make the change, in dollars of margin per month.
- Change it, measure it, and go back to step three. Make the change on the accounts that need it. Watch margin and retention for sixty days. Compare the result to what you wrote down in step four. Then repeat. Provider prices will move, features will change, and new heavy accounts will arrive. The loop is the product, not the dashboard.
Two practical notes.
The tagging step is the one founders underestimate. It touches every place in the code that makes a paid call, and it has to survive refactors. Put it in one wrapper that every call goes through. If a call can be made without a customer tag, someone will make it that way.
The decision step is the one founders skip. It is uncomfortable to tell a happy customer their plan is changing. It is more uncomfortable to find out at the next funding round that your best logo has been losing you money for two years.
The moves available once you can see margin
Seeing margin by account gives you four levers. Each has a cost to the customer relationship and a speed at which it works. Start with the ones the customer cannot see.
| Lever | What it is | Customer sees it? | Speed | Best when |
|---|---|---|---|---|
| Serve it cheaper | Route easy requests to a smaller model, cache repeated calls, trim context, cap agent loops | No | Days | Cost is high across many accounts, not just a few |
| Limit it | Fair-use caps, rate limits, or a monthly budget per plan with overage | Only at the cap | Weeks | A few accounts run far above the plan’s design |
| Package it | Move a costly feature to a higher tier or a separate add-on | Yes | One billing cycle | A feature’s cost is concentrated in accounts that value it |
| Price it | Raise the plan price, add a usage component, or move to credits or outcomes | Yes | One to two billing cycles | The whole plan is underpriced for how customers use it |
Serve it cheaper must always come first. MarginWard and others list the same fixes: shorten the context you send, cap output length, route by difficulty, and cache. None of them changes the invoice the customer receives. In many products these alone move margin by ten points. If you have not done them, you do not yet know whether you have a pricing problem.
Limit it is the next step and the most underused. A fair-use cap set at the ninety-fifth percentile of current usage touches 5 percent of accounts and leaves the rest alone. The accounts it touches are the ones losing you money. Say what the cap is, show the customer where they stand against it, and give them a path to buy more. A cap with no path to buy more is a churn event. A cap with one is an upsell.
Package it works when the cost sits in one feature. If the document agent costs five times what chat costs, and a third of your customers use it, the agent is a tier, not a feature of the base plan. The customers who use it are the ones who will pay for it. The ones who do not will stop subsidizing it.
Price it is last because it touches everyone and takes the longest to show results. Monetizely reports that AI companies on pure per-seat pricing ran around 40 percent lower gross margins than those on usage or outcome pricing, and that hybrid models (a base fee plus usage) went from 27 to 41 percent of companies in a year. Those are unattributed industry figures, but the pattern matches what the cost structure predicts.
A base fee covers the fixed cost. A usage component tracks the variable cost. Credits give customers a number they can budget against. Outcome pricing, where you charge per resolved ticket or per processed document, ties price to value and cost to the same unit, and is the direction most of the market is moving.
The order matters. A founder who jumps to repricing before fixing serving cost raises prices on customers who can be profitable at the old price. A founder who fixes serving cost first often finds the pricing problem shrank to a handful of accounts that a cap can handle.
The catch with usage pricing
Usage pricing looks like the clean answer. Cost varies with usage, so charge for usage and margin takes care of itself. In practice it trades a margin problem for five others, and a founder must know them before moving.
Customers cannot predict the bill. Finance teams budget in fixed amounts. A line item that swings 40 percent from one month to the next gets escalated to procurement, and the fix the customer asks for is a cap. A cap on a usage plan is a flat plan with extra steps, and you have spent a quarter of engineering to arrive back where you started.
Metering has to be right, every time. A disputed usage count is a credit memo, a delayed payment, and a dent in trust. The customer cannot check your meter, so every dispute is settled in their favor or costs you the relationship. Each one costs more to handle than the overage was worth. Classic software never had to defend an invoice line by line. Usage billing does.
Usage is not value. Charging per token bills the customer for your own prompt length and your retries. Charging per document or per resolved ticket is better, but it means you have picked a unit, and the unit shapes behavior. Price per document and customers batch work into fewer, larger documents. Price per seat and they share logins. Whatever you meter, customers will game it, and some of what they cut is usage you wanted.
Sales cannot quote a number. A rep with a usage price sheet is selling a forecast. Deals close on an estimated annual commitment with a true-up, which turns the renewal into a negotiation over whose estimate was wrong. Enterprise buyers in particular want a number they can put in a contract and forget.
You serve first and collect later. Usage billed in arrears means the heavy account that was losing you money on a flat plan is now also your largest receivable. The cost went out to the model provider on their terms. The revenue comes back on yours, thirty to sixty days later, if the invoice survives the dispute above.
None of this means usage pricing is wrong. For products where the unit of work is clear and the customer already thinks in that unit, it is the right end state, and the market is moving there. It means usage pricing is a destination, not a first move. Three of the four levers above work inside a flat plan and avoid every problem on this list. The margin view is what tells you whether you need the fourth at all, and for most companies the answer is not yet.
Three worked examples
The numbers below are made up to be typical, not drawn from any one company. The shapes are real.
Example 1: the flat plan with a whale
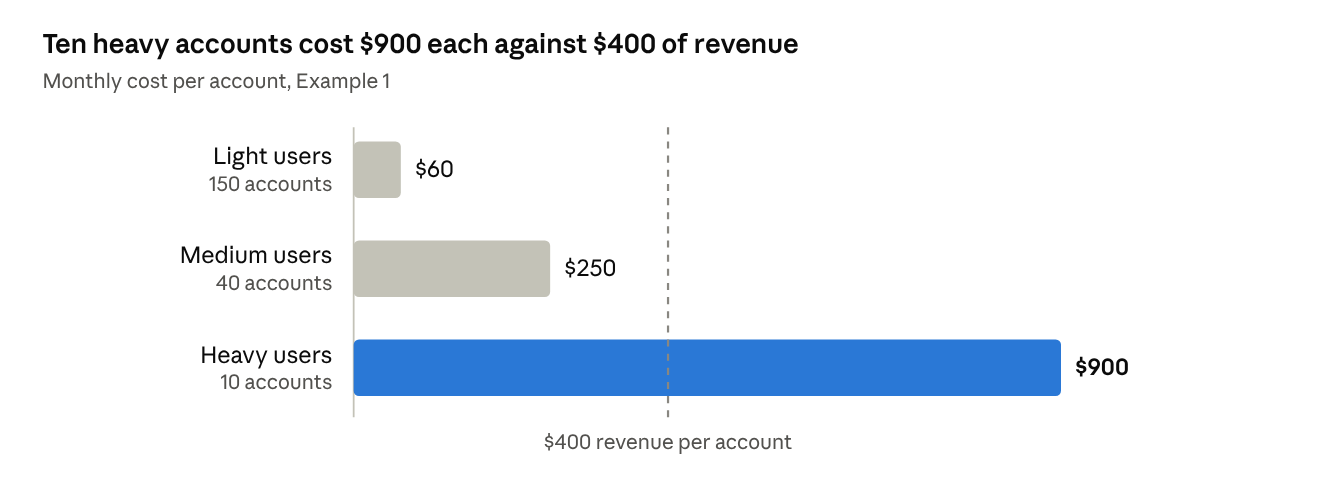
A contract review product charges $400 a month per company, flat. It has 200 customers, so $80,000 in monthly revenue. The model and parsing bill comes to $28,000 a month, a gross margin of 65 percent. The founder is content.
After tagging calls by account, the picture changes.
| Segment | Accounts | Revenue per account | Cost per account | Margin |
|---|---|---|---|---|
| Light users | 150 | $400 | $60 | 85% |
| Medium users | 40 | $400 | $250 | 38% |
| Heavy users | 10 | $400 | $900 | -125% |
Ten accounts cost $9,000 a month and pay $4,000. They are 5 percent of customers and 32 percent of cost. The founder had been reading a 65 percent average and thinking the business was fine.
The fix is a cap and a tier, not a price increase. A fair-use limit at the point where the medium users top out, and a $1,200 Enterprise plan above it with higher limits. Eight of the ten heavy accounts take the Enterprise plan because the product is now part of how they work. Two churn. The net effect is that revenue rises by about $5,600 a month and cost falls by about $1,800 from the two departures, and margin on the remaining heavy accounts moves from -125 percent to 25 percent. Blended margin goes from 65 to about 69 percent, with 150 light customers untouched.
Example 2: the feature nobody priced
A customer support product sells seats at $50 a month. Last year it added an agent that drafts replies from the knowledge base. The agent is free in every plan. Six months later the model bill has tripled and margin has fallen from 78 to 61 percent.
Margin by feature shows the agent costs $11 per seat per month on average, but usage is concentrated. A quarter of seats use the agent heavily, at around $35 a seat. The rest barely touch it.
The move is packaging. The agent becomes a $25 add-on per seat. The heavy quarter buys it, because it is now doing part of their job. The remaining seats lose a feature they were not using. Revenue on the heavy seats goes from $50 to $75 against a cost of $35 plus hosting, and the base plan returns to its old margin. The product also caps agent drafts per seat per day at a level the heavy users rarely hit, which stops the long tail.
Example 3: the agent that loops
A research product runs an agent that searches, reads, and summarizes. Average cost per research task is $0.40, and the product charges $2 a task in credits. Fine on paper.
Cost by task shows a long tail. Most tasks cost $0.20. Five percent cost over $3, because the agent loops when a source is ambiguous and calls an outside data vendor on each loop. Those 5 percent of tasks are 45 percent of cost.
No pricing change is needed. The engineering fix is a loop limit of four with a cheaper model on the first two passes, and a cache on the data vendor call so a repeated lookup within a task costs nothing. Average cost per task falls to $0.24. Margin per task goes from 80 to 88 percent and the long tail disappears. The customer sees nothing except, in a few cases, a slightly shorter report.
The common thread is that in none of the three cases did the founder raise the headline price. The margin came from seeing which accounts, features, or tasks were out of line and changing only those.
Where the tools stand today
Three kinds of tools touch this problem, and they come from three directions. Billing tools start from revenue. Observability tools start from the model call. Cost-attribution tools start from the invoice. None of them, as of this writing, closes the loop by telling you what to change.
| Category | Examples | Starts from | Meters usage | Attributes cost to customer | Shows margin by customer | Suggests a change |
|---|---|---|---|---|---|---|
| Billing | Stripe Billing, Metronome, Orb, Lago, Chargebee | What the customer pays | Yes | Not as a core feature | No | Orb offers pricing simulation against past usage |
| Model observability | Helicone, LangSmith, Langfuse, Requesty | The model call | Token counts, latency | By tag, if you tag | Cost only, not revenue | No |
| AI cost attribution | Lava, Revenium | The provider invoice | Yes | Yes, by customer, feature, and agent | Lava shows margin by customer, and Revenium shows cost of goods by feature | Lava alerts on provider price changes, and Revenium stops runaway agents |
The billing tools are the most mature and the furthest from the problem. They know revenue to the cent and cost not at all. Stripe sits closest to the join, because it already holds every customer’s payment record and meters usage, and it can add provider cost ingestion with little effort. It has not done so as a product, and nothing suggests it will take on the advice layer.
The observability tools are where engineers already look. They count tokens per call and can group by any tag you send. They stop at cost, because they never see the revenue side, and they miss the tool and data invoices that are not model calls.
The attribution tools are the newest and closest. Lava records provider charges per request and rolls them up by customer, product, and model, with margin shown live by customer. Revenium captures model calls, tool calls, and outside API hits and attributes each to the customer, feature, and agent that caused it, with spend limits and automatic stops. Both are strong at steps one through three of the loop above.
What all of them leave to the founder is steps four and five. They show the account at negative margin. They do not say whether to cap it, repackage it, reprice it, or re-route it, and they do not predict what each choice does to margin and churn. That decision still lives in a founder’s head and a spreadsheet, which is where this article started.
Two cautions on this table. Features in this market change monthly, so check each vendor’s own site before relying on a cell. And the Hackernoon comparison was written by a vendor in the category, so its framing favors its author.
Common mistakes and the limits of the approach
Pricing from the model bill alone. The most common error and the one Revenium’s examples are built around. The model line is the visible one, so the price gets set against it. In agent products the tool and data calls behind it can run several times larger. If your cost view comes only from token logs, assume it is low.
Pricing from the average. An average margin of 65 percent is consistent with every account at 65 percent and with a third of accounts losing money. The number you need is the distribution. Look at the top 5 percent of accounts by cost before you look at anything else.
Waiting for prices to fall. Inference does get cheaper, fast. But a customer who finds a use that scales will grow usage faster than the provider cuts prices, and a flat plan has no way to catch it. Falling cost is a reason to recheck prices every quarter, not a reason to skip the check.
Fixing it with a price increase first. Raising the headline price punishes the 80 percent of customers who were profitable to fix the 5 percent who were not. Serving cost and caps come first. Repricing is the last lever, not the first.
Building the dashboard and stopping. A margin view that no one acts on is a cost, not an asset. If the company cannot name one account whose plan changed because of the view, the view is not working.
Caps with no path to buy more. A limit that blocks a customer and offers nothing is a churn event dressed as a cost control. Every cap needs a next tier or an overage price beside it.
Treating margin as the only goal. Some accounts are worth serving at a loss for a while. A design partner, a logo that opens a market, a customer whose usage teaches you where the product needs to go. The margin view must tell you that you are losing money on them, and you must be able to say why. The mistake is not knowing. The approach also has limits.
It does not tell you what customers will pay. Cost sets a floor. Value sets the ceiling. Margin-based pricing keeps you above the floor and says nothing about how close to the ceiling you can get.
It works best when usage is uneven. A product where every customer costs about the same gets little from it. The spread is what makes the work pay.
It depends on the tagging being right. An agent that spawns sub-agents, or a shared cache that serves many customers, makes attribution a judgment call. Pick a rule, apply it the same way everywhere, and write it down. Perfect attribution is not available. Consistent attribution is.
And it is a loop that needs an owner. Not finance alone, which sees invoices but not features. Not engineering alone, which sees calls but not revenue. Not product alone, which sees adoption but not cost. In most companies this lands with whoever owns pricing, and in most early companies that is the founder.
Where to start this quarter
You do not need a new tool to begin. You need one month of tagged cost and one list.
- Week 1. Add a customer tag and a feature tag to every paid call. Put it in one wrapper. Ship it.
- Weeks 2 to 5. Let a month of tagged data build up. Pull your provider usage exports and your billing export into one table, joined on customer.
- Week 6. Sort by cost. Look at the top 5 percent of accounts and the top three features. Compute margin for each. This is the list.
- Week 7. For each account on the list, pick one lever. Serve it cheaper if the cost is in how you built it. Cap it if the account is far above the plan’s design. Repackage it if one feature is the cause. Write down what you expect the change to do in dollars a month.
- Weeks 8 to 13. Make the changes. Watch margin and retention on those accounts. Compare to what you wrote down.
At the end of the quarter you will know three things you did not know at the start. Which accounts lose you money. Whether the fix is engineering or pricing. And whether your customers accept a cap or a tier when you give them a reason and a path.
If the answer to the last one is yes, and it usually is, then the loop becomes part of how the company runs, and a tool to automate steps one through three is worth buying. If the answer is no, you have learned something about your market that no dashboard tells you.
The principle underneath all of it is old. Know what each thing you sell costs you to make. Software spent twenty years not needing to. AI products need to again.
Sources
- Revenium, Why Your AI Products Don’t Know Their Margins
- MarginWard, AI SaaS gross margin guide
- Monetizely, The economics of AI-first B2B SaaS in 2026
- Lava, How does Lava help me track costs and set margins
- Hackernoon (Credyt), Best usage-based billing platforms for AI companies in 2026
Figures from Monetizely and MarginWard cite industry reports without naming them, so read them as directional. The worked examples in this article are invented to show the shapes, not drawn from any one company.
Defined in the glossary: token-based pricing , AI credits
Published .
Cite this
Couch, C. (2026). Margin-Based Pricing for AI Products. Ends at Cash. https://chriscouch.ai/essays/margin-based-pricing-ai-products/
BibTeX
@misc{couch2026marginbasedpricingforaip,
  author = {Couch, Chris},
  title = {Margin-Based Pricing for AI Products},
  year = {2026},
  howpublished = {Ends at Cash},
  url = {https://chriscouch.ai/essays/margin-based-pricing-ai-products/}
}